ODI now with auto-focus
Observing with ODI just got a little more comfortable.
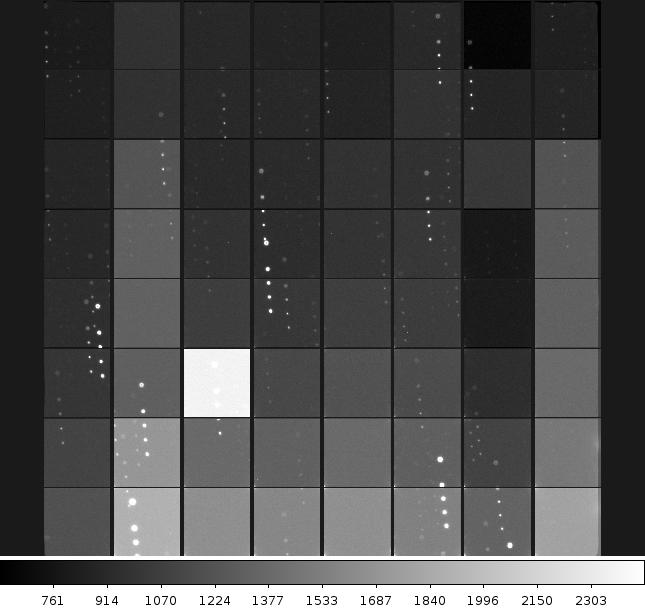
To keep ODI in focus and to get the best possible image quality requires regular focus checks. This is done by taking a focus sequence that exposes the target area, closes the shutter, offsets the telescopes by a bit, changes the focus by a certain increment and opens the shutter again. This is repeated several times. After reading out, you will end up with an image where every star appears several times for different focus positions (see image below).
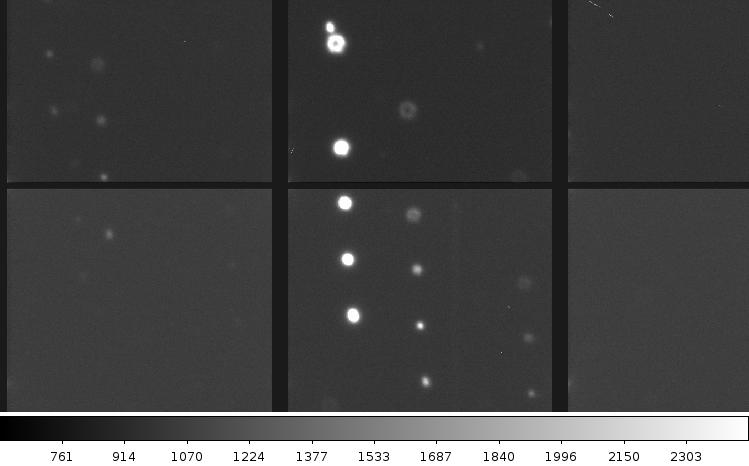
If you zoom in a little further, the differences between the focus positions become a little more obvious:
The traditional way up until now was to load the frame into ds9 and inspect stars using the IRAF imexam tool to see which focus gives the sharpest images or the smallest FWHM. This process, however, is tedious, time-consuming (only a minute or two per focus sequence, but it adds up over the course of a night).
Entry the new auto-focus tool.
The new way of judging focus quality is incorporated into the pODI SAMP Listener that already handles the automatic data reduction in the background. Every time a new focus exposure is read out, it is now automatically analyzed in the background. Based on seeing measurements and positions of each star in the field, the script automatically finds which stars belong to the same sequence and sorts them into pairs. Once that’s done for all OTAs, the user is presented with a focus plot like the one below – generated using the very same data shown in the images above:
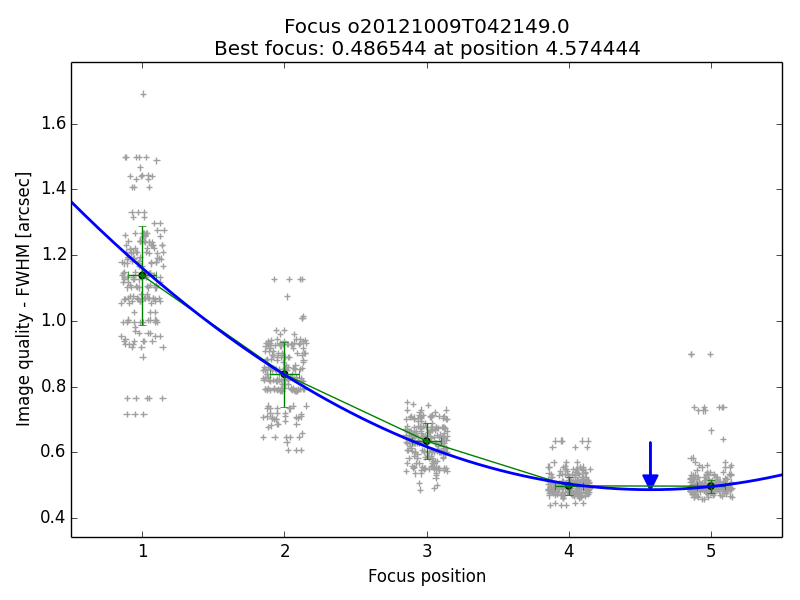
In this plot, every grey data point is an individual seeing measurement in one of the star sequences. Green data points are median measurements and their standard deviation, and the solid blue line is a polynomial fit to the data. Ultimately what the observer is interested in is the position of the blue arrow, marking the best focus position and the corresponding seeing value.
All that is done in the background and takes only 10-15 seconds from receiving the new frame to displaying the new focus plot, allowing the user to get on with her/his science without “wasting” precious observing time.